Every Measurement Behind This Site, in One Place
Four studies across 1,667 files - what chroma subsampling costs, which preset is worth using, and how much lossless PNG recompression saves. All of it reproducible.
Most compression advice is written by people who did not measure anything. We did, and this page collects the results so you can check them rather than take our word for it.
Four studies, 1,667 image files, one metric throughout: SSIMULACRA2 against the original. Every chart below is drawn from the raw numbers, and the scripts that produced them are described at the end.
The preset question
Our compression page used to default to a setting called Balanced, which uses Mozjpeg's tuned quantisation tables. The captions under the buttons promised savings of roughly 3% and 5-10%. Those figures came from six images.
We re-ran it on 320.
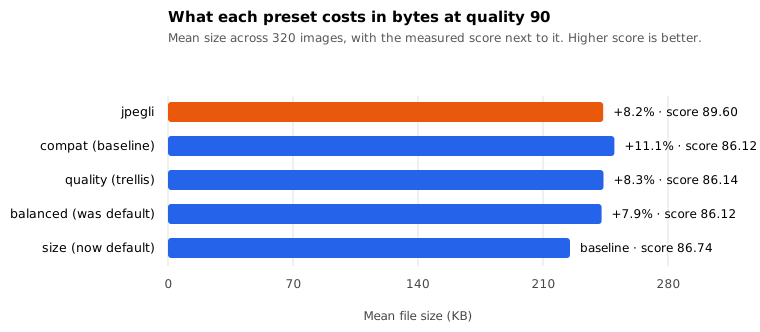
The tuned table is not a free win. It costs about 8% more bytes than the standard tables at the same slider position, and its measured score is slightly lower. The only preset that buys something real with its extra bytes is jpegli, and what it buys is quality rather than size.
That is why the default is now the standard tables. The full write-up, including the two captions that turned out to be wrong, is here.
Does the tuned table earn its keep somewhere else
The tuned tables exist for a reason, and the reason is heavy compression. So we tested the rest of the curve rather than extrapolating from quality 90.
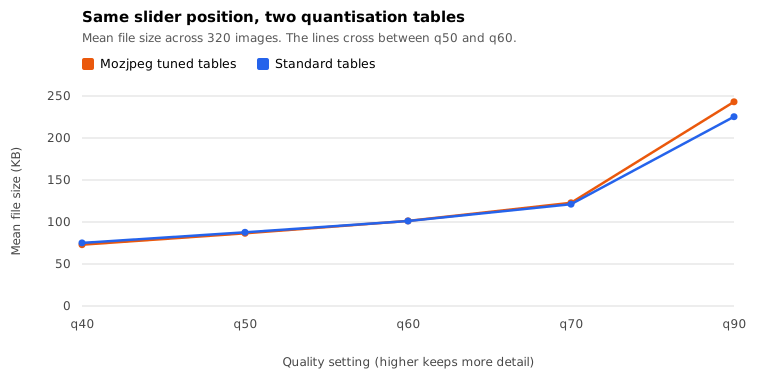
Below quality 60 the tuned tables do produce smaller files, by 1.4% to 2.9%. Above 60 they lose on size as well as score. The lines cross somewhere between 50 and 60.
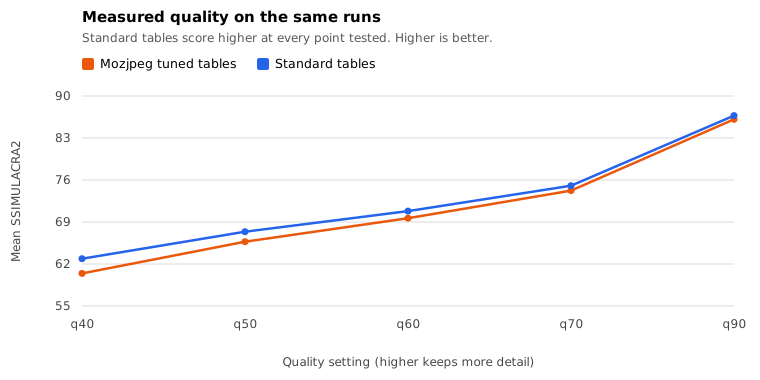
The score line does not cross anywhere. Standard tables score higher at q40, q50, q60, q70 and q90.
So "designed for heavy compression" means smaller at the same nominal setting, not better. The full curve test is here.
What chroma subsampling actually costs
This is the setting that damages more compressed photos than any other, and it is applied by default in almost every online tool before the quality slider is consulted.
We took 323 images, re-encoded each one twice at the same quality with only the sampling changed, and scored both against the original. Every single image scored worse at 4:2:0. The mean fell from 87.82 to 82.68, and the files were 22.1% smaller.
That is a real trade, not a hidden defect, and the measurements and method are here.
PNG: the one case with a guarantee
JPEG cannot promise that your pixels survive. PNG recompression can, so we tested whether it holds.
261 real PNG files, recompressed with the same oxipng call the site uses, then decoded and compared to the original pixel by pixel. Every file got smaller, none grew, and the mean saving was 12.68%.
Eight files came out with different bytes. All eight had transparency, and in every one, zero visible pixels changed: the difference was colour stored underneath fully transparent areas. The PNG study is here.
Finally, the metadata question
Everyone warns that photos leak your location. We parsed 1,086 JPEGs with a proper EXIF reader, cross-checked the count with an independent library, and found almost no usable GPS data at all.
What we did find is that metadata is usually tiny (568 bytes, 0.21% of the file) and occasionally enormous. One file in the set was 90.7% metadata by weight. The full analysis is here.
What these numbers changed
Measurements are only worth publishing if they change something. Ours did:
- Three interface captions were wrong and were rewritten
- The default preset changed from the tuned tables to the standard ones
- The PNG guarantee is now stated as "pixels identical" rather than "high quality", because that is what we can actually promise and verify
Method notes
Every study resizes the reference to 768 px on the long edge before encoding, so results are comparable across pages. The quality sweep reuses the reference images from the preset study rather than regenerating them, which is why both pages agree exactly.
Scores come from SSIMULACRA2, which tracks human judgement well on average. "On average" is doing real work in that sentence, so treat a 0.5-point difference as noise and a 2-point difference as real.
Two of the four studies use image libraries from one machine. They are honest samples, not representative ones, and each write-up says so.
If you run any of this against your own files and get a different answer, we want to know. A contradiction with a concrete example is more useful to us than agreement, and the address is on the about page.